Monitoring and observability are crucial aspects of managing and maintaining software applications and infrastructure.
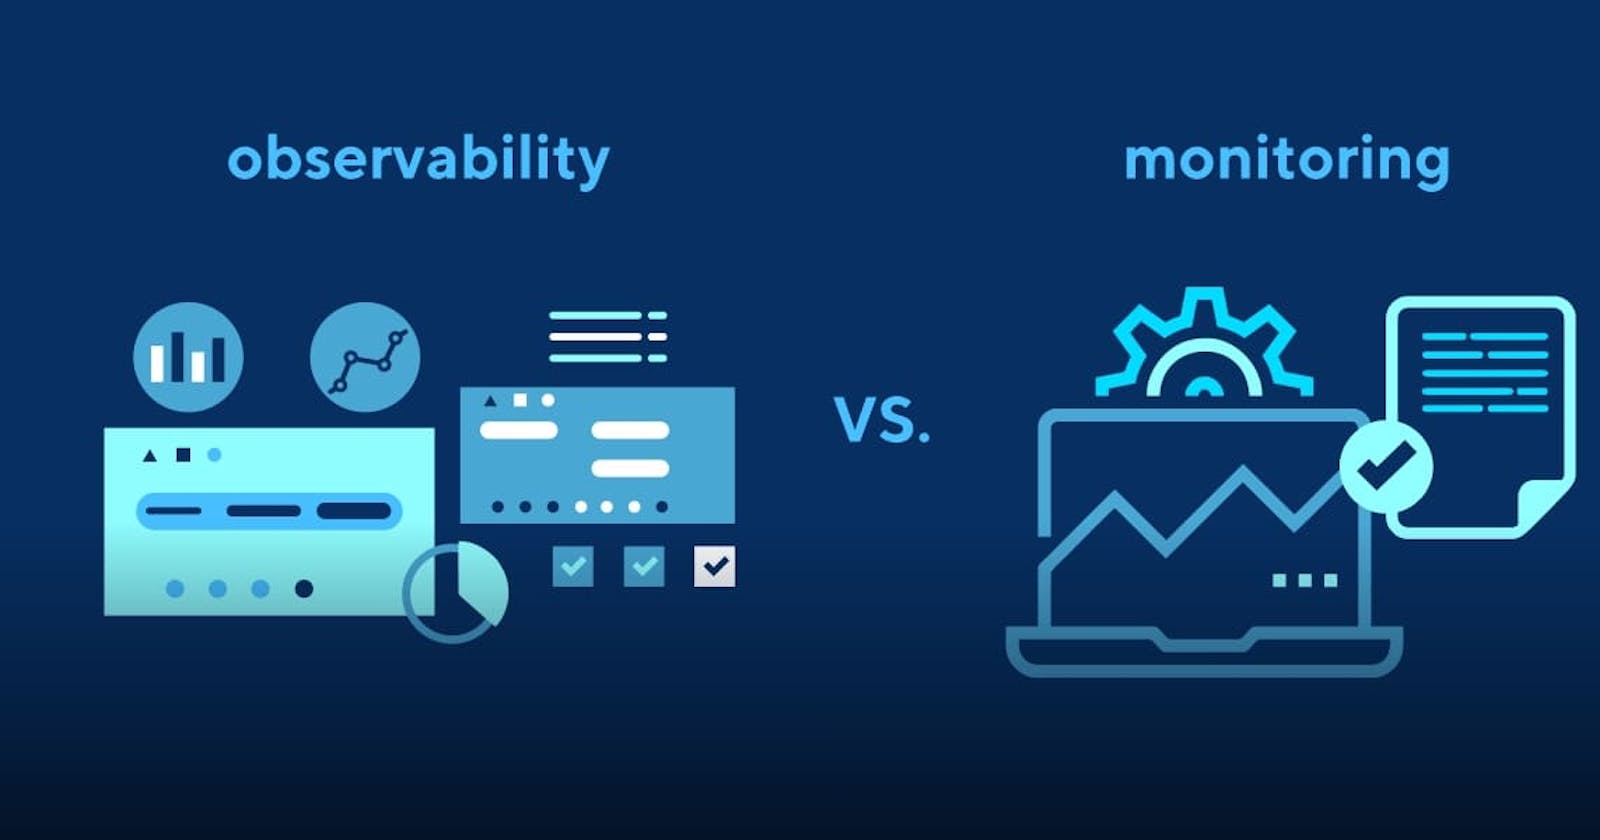
Monitoring involves the systematic collection and analysis of data related to various aspects of an application or system. This data typically includes metrics such as CPU usage, memory utilization, network traffic, response times, error rates, and more.
Observability, on the other hand, goes beyond monitoring and seeks to provide a holistic understanding of system behavior and performance. It involves capturing not only metrics but also logs, traces, events, and other contextual information.
There are various solutions available in the market to enable Monitoring and Observability. Some of them are listed below:
Datadog.
Datadog is SaaS (Software as a Service) monitoring solution. The Datadog agent installed on the end machine/ cluster collects the metrics and sends them to Datadog's servers securely. It provides lots of integrations and plugins. We can define different alerts based on the conditions. Datadog is very user-friendly and also provides RBAC.ELK Stack (Elasticsearch, Logstash and Kibana)
Elasticsearch is a distributed, open-source search and analytics engine built on top of the Apache Lucene library.Logstash - Logstash is an open-source data processing pipeline tool that allows you to collect, transform, and ingest data from various sources and send it to different destinations.
Kibana- Kibana is an open-source data visualization and exploration platform that works in conjunction with Elasticsearch.
Beats- Beats are lightweight log shippers. It can be used to send data to Elasticsearch or messaging queue such as Kafka. We have different types of beats (Filebeat (reading log files), Metricbeat (compute metrics), Heartbeat (URL monitoring) etc.Prometheus and Grafana.
Prometheus - It is designed to collect and store time-series data, allowing users to monitor and analyze the performance and health of their applications, infrastructure, and services. It works by periodically scraping metrics from various targets such as servers, applications, and databases.Grafana - Grafana is an open-source data visualization and monitoring platform that works in conjunction with various data sources, including Prometheus. It allows users to create and display real-time dashboards, graphs, and alerts based on the collected data.
We can use Grafana with various data sources such as graphite, and elastic search as well.
Telegraf, Influxdb and Grafana.
Telegraf - Telegraf is an open-source server agent written in Go that is designed to collect, process, and send metrics and event data to various data stores or monitoring systems.
Influxdb- InfluxDB is an open-source, scalable, and high-performance time-series database (TSDB) specifically designed to handle the storage and retrieval of time-series data.
Grafana- As updated previously, Grafana is a visualization tool and it can also use Influx db as the data source.
Choosing the monitoring solution can depend on various factors, some of which are:
1. What needs to be monitored
2. Current Infrastructue
3. Criticality of application
4. Cost
5. Technical Skills of the people working on it.
6. Support
using open-source comes with some drawbacks related to support as you don't get an enterprise level of support and may have to rely on the community in case of any issues.
"Note: The images used in this [document/presentation/article] are strictly for educational purposes only."
