

Monitoring in Kubernetes is crucial for observing the health, performance, and resource utilization of your cluster, as well as individual applications running within it. It can be done using Prometheus and Grafana.
Prometheus is a popular monitoring and alerting tool commonly used in Kubernetes environments. It is an open-source tool that exposes metrics that can be further used in Grafana to create different visualizations.
Grafana is a popular open-source data visualization and monitoring tool that can be used alongside Prometheus (or other data sources) to create interactive dashboards and graphs for monitoring purposes.
#Creating a monitoring namespace
kubectl create ns monitoring
helm install prometheus prometheus-community/prometheus -n monitoring
kubectl get all -n monitoring
kubectl expose service prometheus-server --type=LoadBalancer --target-port=9090 --name=prometheus-server-ext -n monitoring
kubectl get svc -n monitoring
Installing Grafana using Helm
helm repo add grafana https://grafana.github.io/helm-charts -n monitoring
helm install grafana grafana/grafana -n monitoring
kubectl expose service grafana --type=LoadBalancer --target-port=3000 --name=grafana-service -n monitoring
kubectl get svc -n monitoring
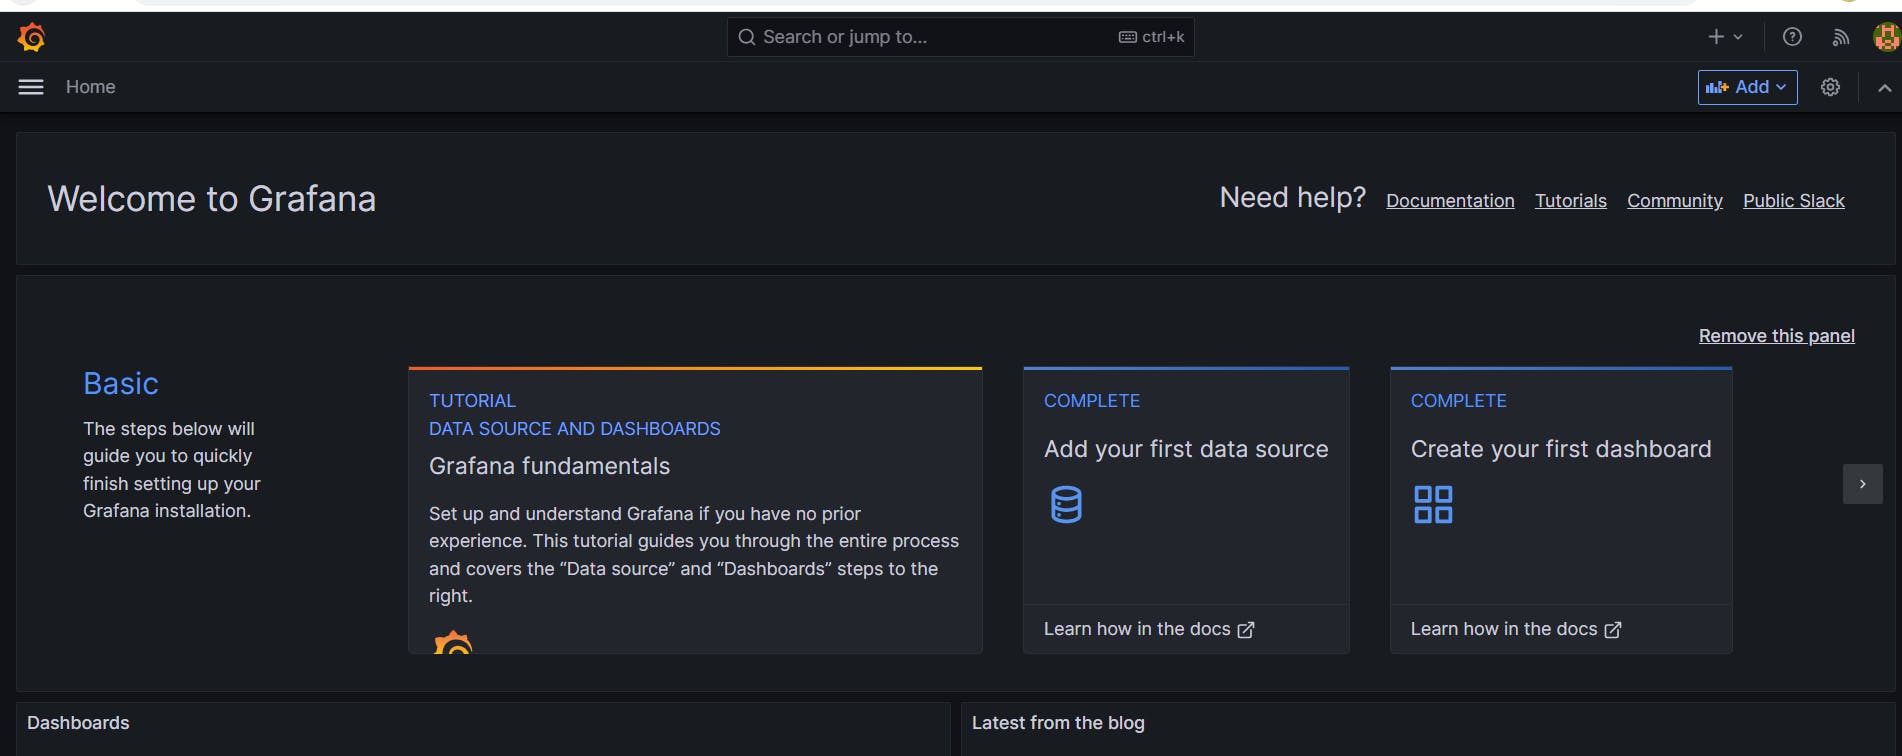
Access the Grafana application on Browser
To log in to Grafana, we need credentials and in Kubernetes, we store sensitive information as secret, so we need to view the base64 encrypted value. we execute the below command:
kubectl get secret grafana -o yaml -n monitoring
copy the value of admin-password from the file and decrypt it
Decryption can be done on the below website
Provide the decrypted value to Grafana login page.
Once logged in to Grafana, we need to add Data Source, in our case it is Prometheus:
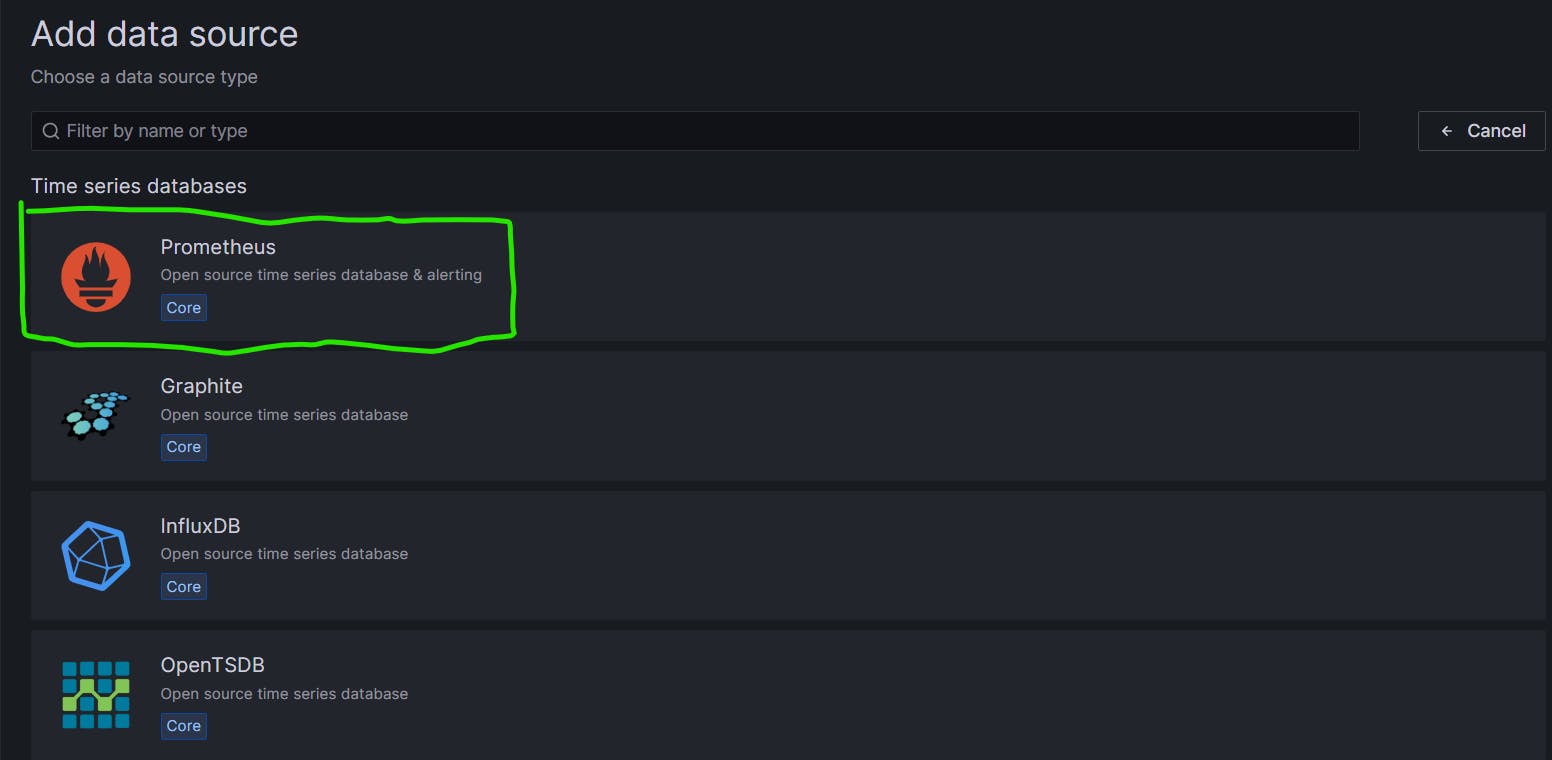
Provide the URL of Prometheus:
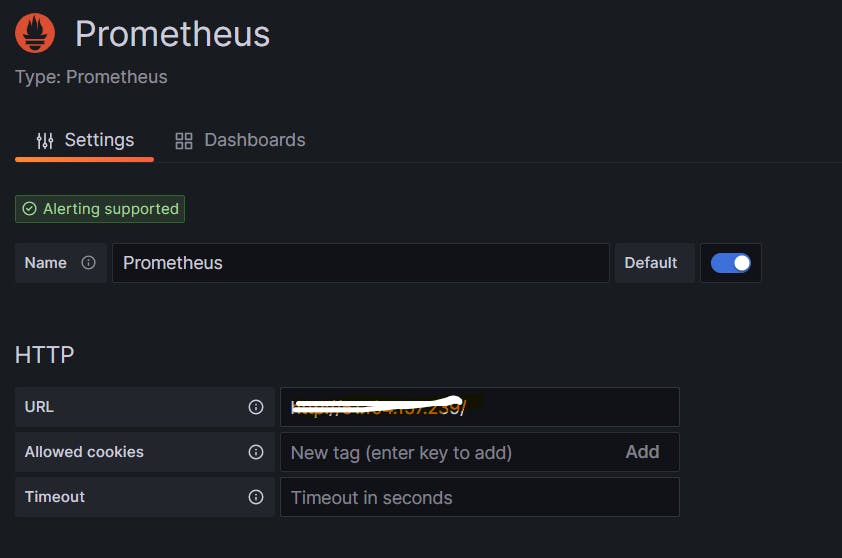
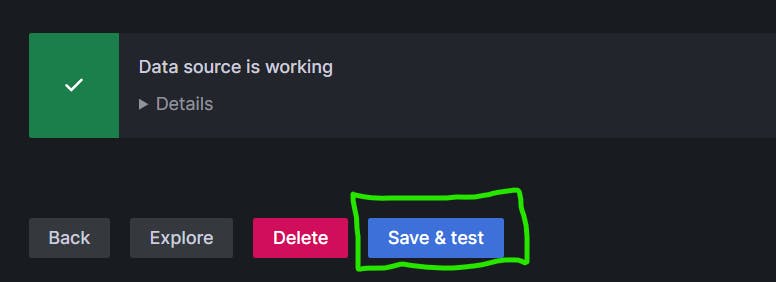
Click on save and test
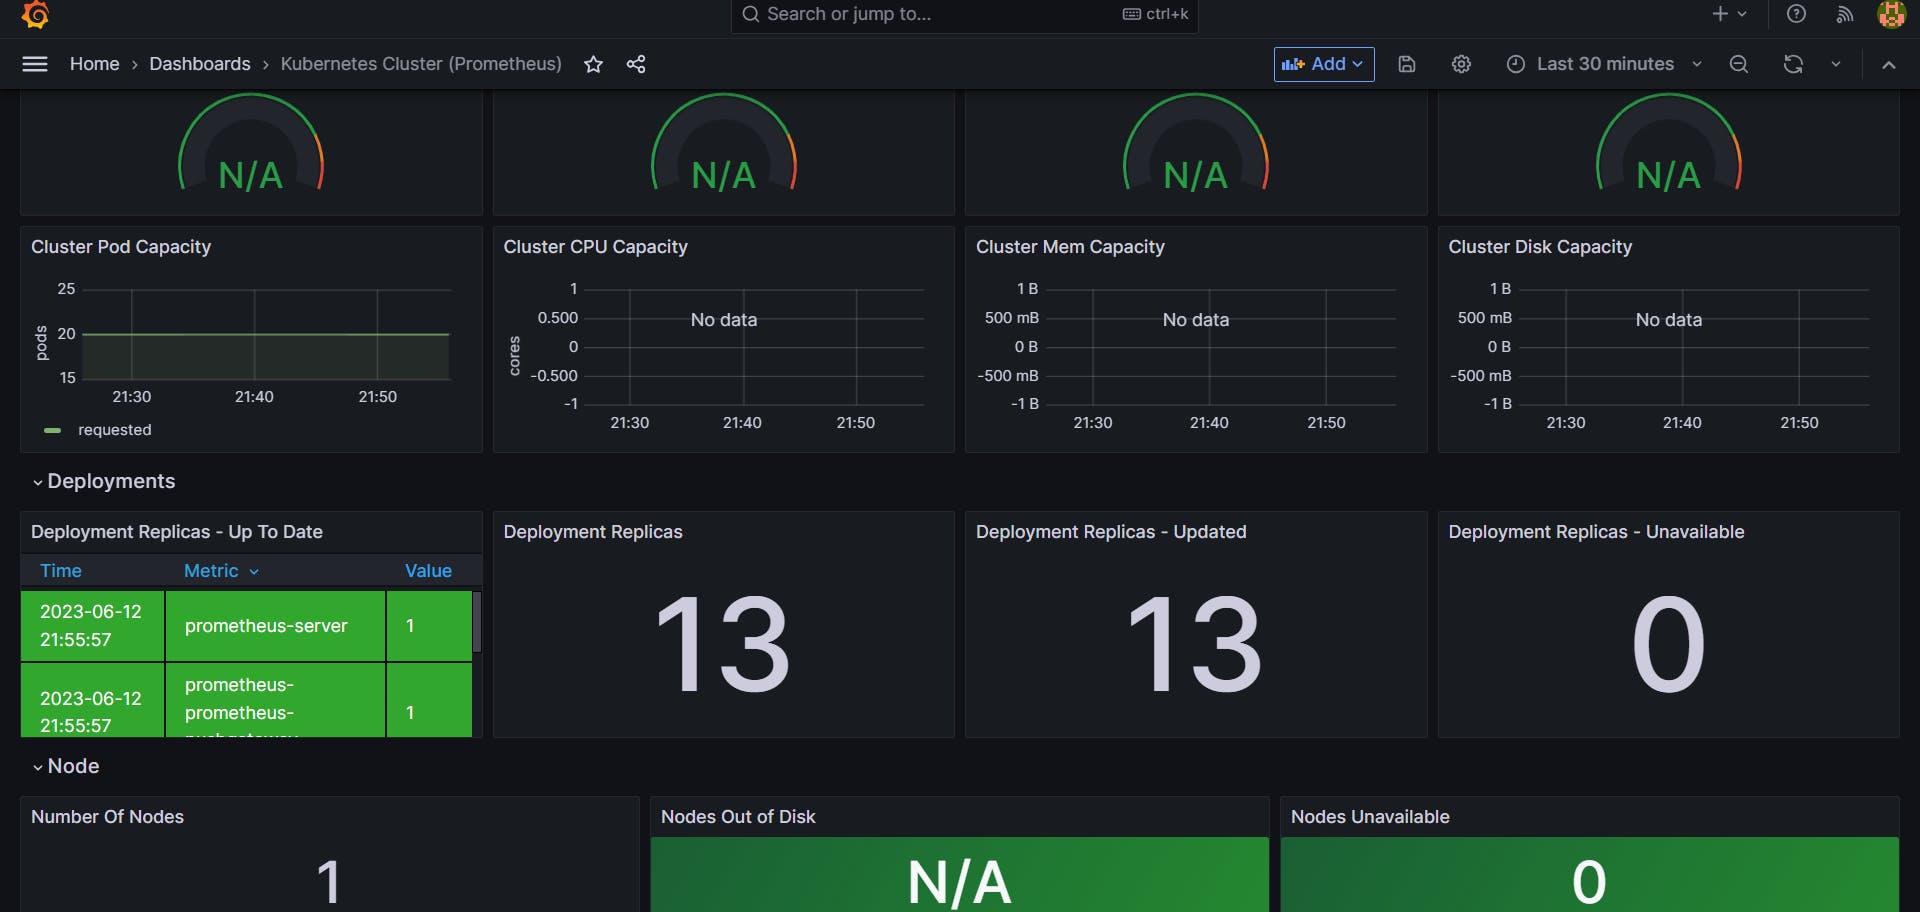
Once our data source is configured, we can now create different dashboards in Grafana.
Dashboard- Dashboards are a combination of different visualizations.
Creating Dashboard- Dashboards can be created in 2 ways. One by manually creating different visualizations and then adding them under one dashboard.
The other way is to import the already existing dashboard provided by Grafana.
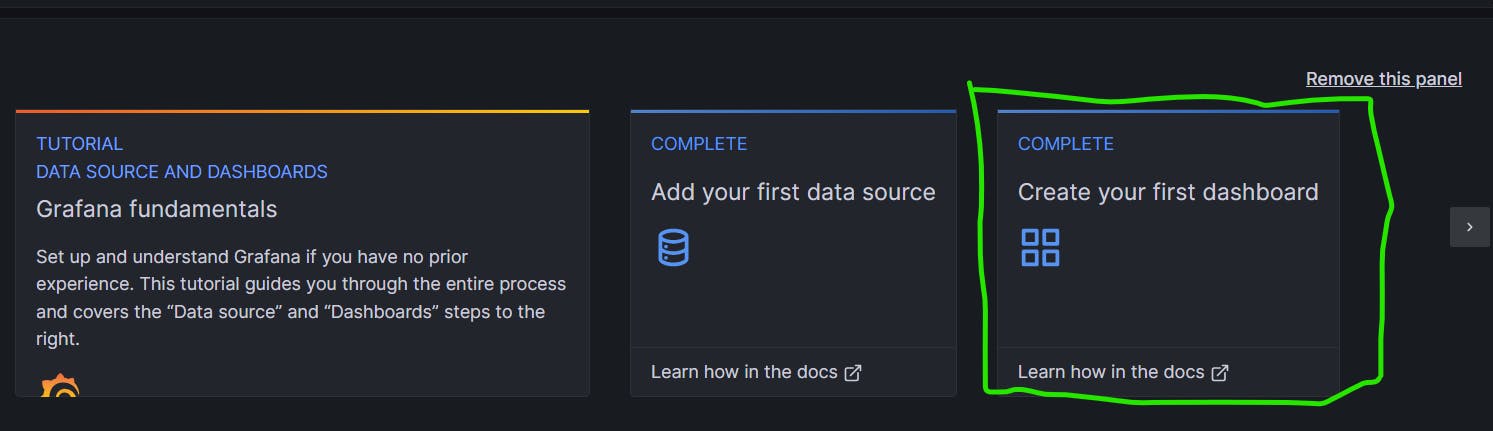
In order to import Grafana dashboard click on "Create your first dashboard"
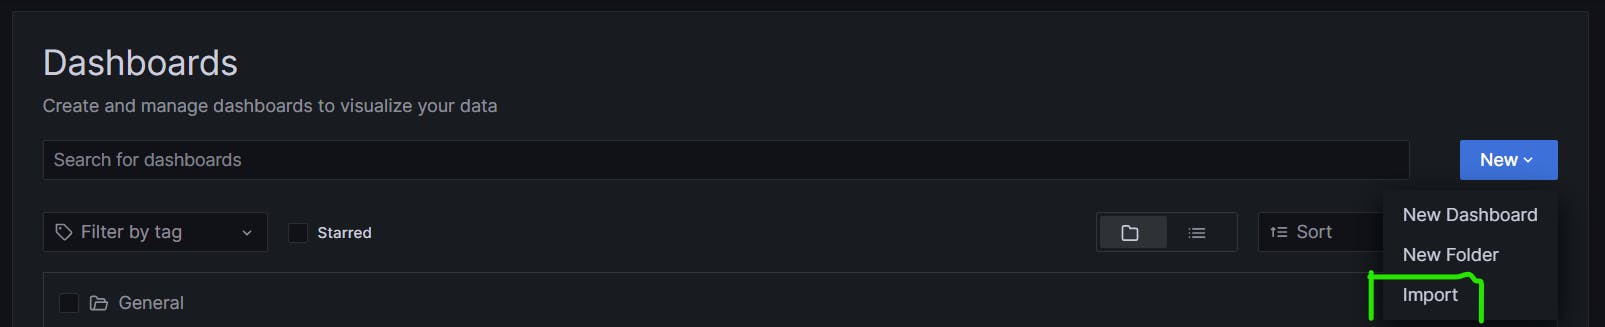
Click on Import
Give the dashboard number (for example 6417, 3662 etc.)

Click on save and to view the metrics during a specific time interval, select the time range from the right above icon.